
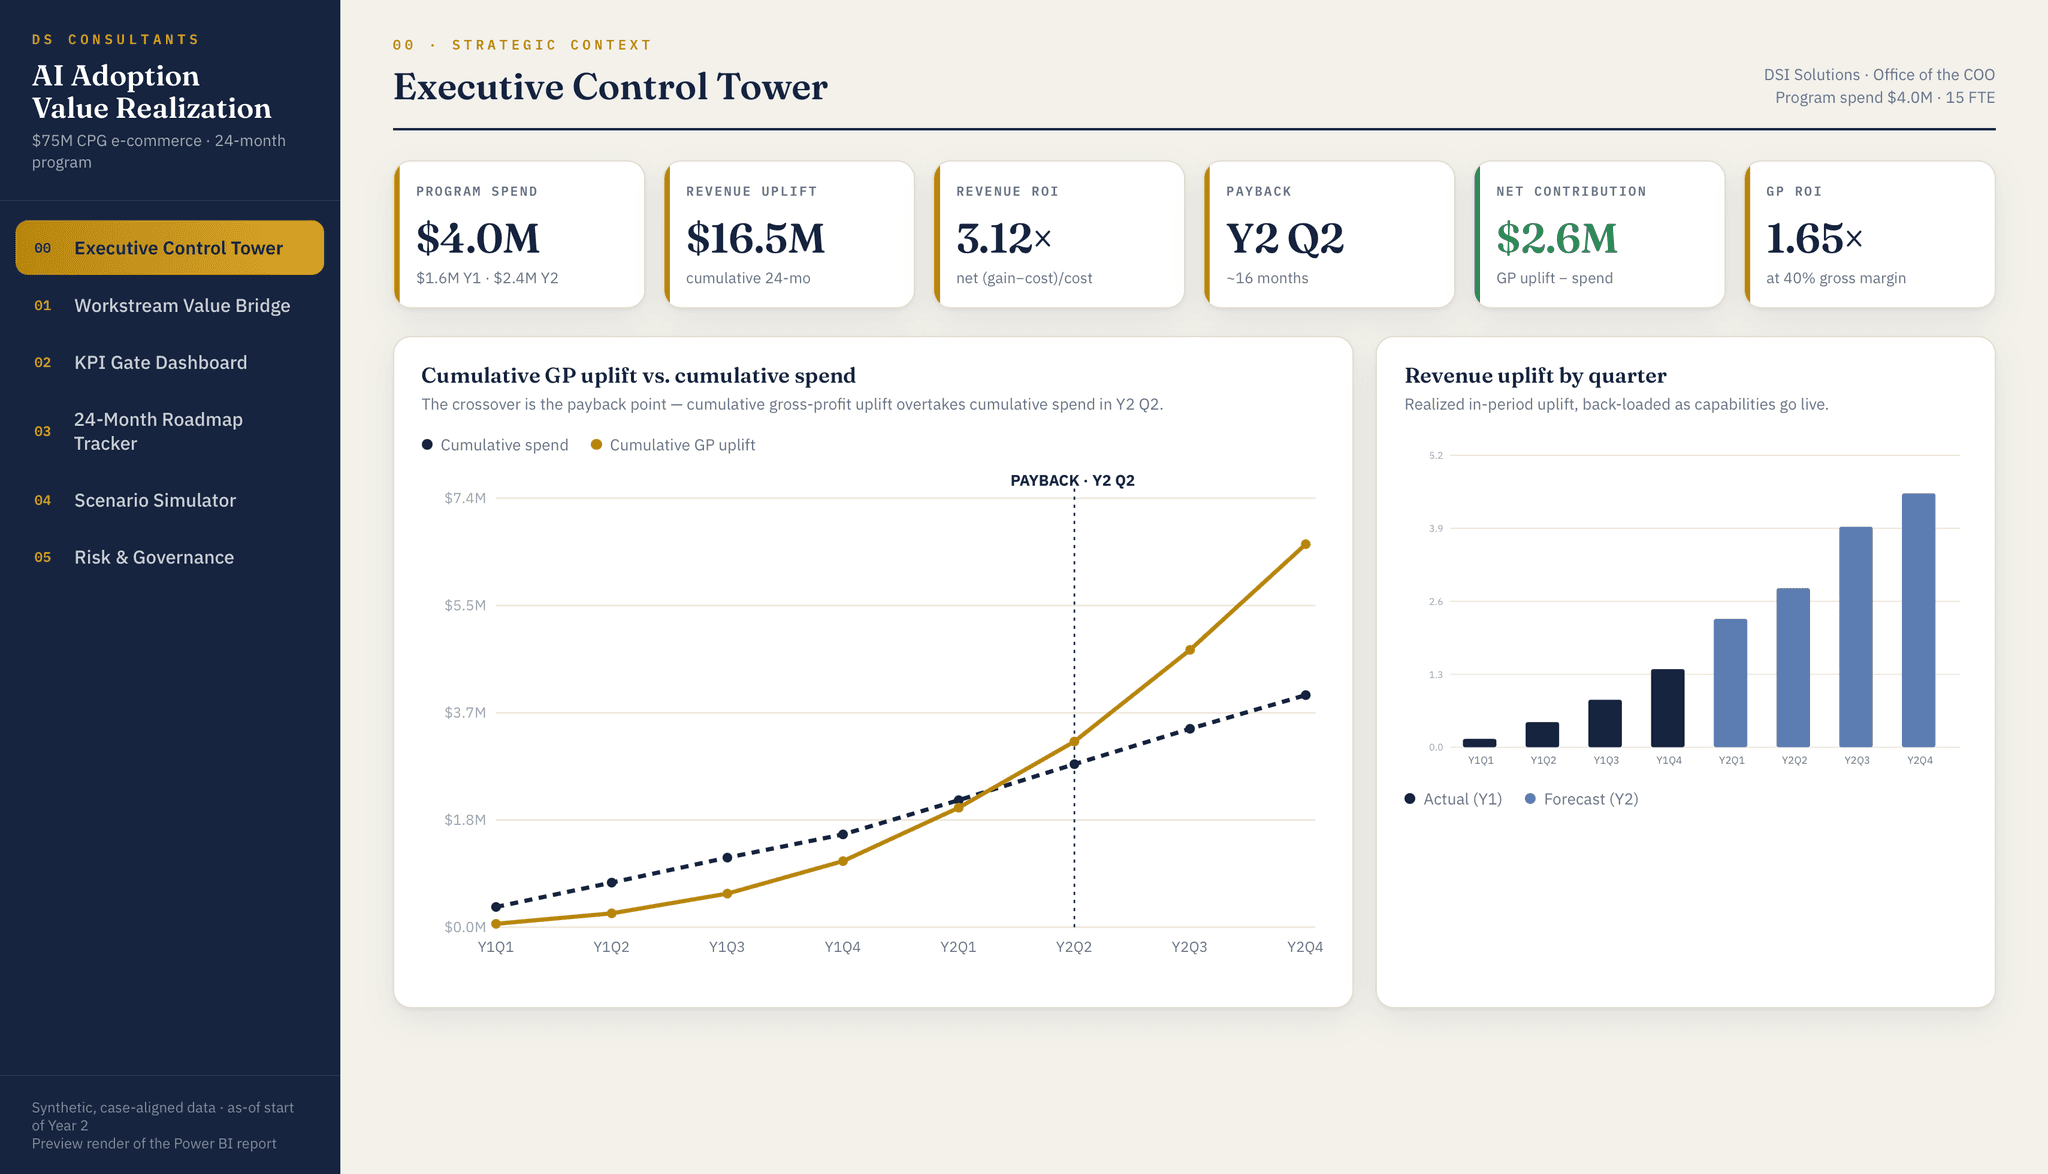
AI Adoption Value Realization Dashboard
An executive Power BI system that turns a two-year, $4M enterprise AI adoption strategy into a tracked value-realization layer, modeling spend, revenue uplift, payback, KPI gates, roadmap progress, scenario NPV, and program risk for a $75M CPG e-commerce business.
This project explores value realization for enterprise AI adoption. For a $75M CPG e-commerce business, a two-year, $4M AI adoption program projected roughly $16.5M in incremental revenue across four workstreams: forecasting and pricing, trend detection, personalization, and customer experience. The challenge was not just proposing the strategy, but proving that value was actually being realized as the investment was deployed.
I built an executive Power BI dashboard that converts a static consulting-style AI roadmap into a living value-realization system. The dashboard allows leadership to track program spend, revenue uplift, gross-profit impact, payback timing, KPI performance, roadmap delivery, financial scenarios, and governance risks quarter by quarter.
I developed the solution end to end, starting with a case-aligned synthetic dataset engineered to reconcile exactly to the program's headline economics. The model ties out to $4.0M in total spend, $16.5M in incremental revenue uplift, $6.6M in gross-profit uplift at a 40% margin, and $2.6M in net contribution. This ensures that the strategic narrative and the dashboard metrics remain internally consistent.
The core of the system is a star-schema semantic model organized around a shared quarter dimension. The model includes seven tables and thirty-four DAX measures, authored as a Power BI Project using TMDL. Revenue uplift is modeled on a realized-in-period basis and allocated across workstreams using an iterative proportional fitting approach, so that the cumulative gross-profit curve crosses cumulative spend at the intended payback quarter.
The report is organized into six executive-facing pages. The Executive Control Tower summarizes spend, uplift, ROI, and payback status. The Workstream Value Bridge decomposes the $16.5M uplift across AI initiatives and compares Year 1 versus Year 2 ramp. The KPI Gate Dashboard evaluates operational metrics against glide-path targets. The Roadmap Tracker monitors delivery progress across the 24-month program. The Scenario Simulator flexes the financial case across Bear, Base, and Bull assumptions. The Risk and Governance page connects underperforming KPIs to specific program risks and owners.
On the financial-modeling side, I separated the program's headline multiple into distinct measures for gross revenue multiple, gross-profit ROI, and net-revenue ROI. This makes the financial interpretation more defensible because each number answers a different executive question. The scenario engine applies workstream-level uplift multipliers, gross margin assumptions, and discount-rate changes before rolling the program into a three-year NPV calculation.
The KPI framework is direction-aware, meaning each metric is evaluated against its own expected improvement path rather than a single global threshold. Metrics are classified into red, amber, or green statuses based on their glide-path performance. I deliberately included red KPI cases and linked them to governance risks, so the dashboard functions as both a reporting layer and an accountability system.
Overall, the project demonstrates how financial modeling, dimensional data design, DAX engineering, and executive BI storytelling can make an AI investment auditable. Instead of stopping at whether AI models were shipped, the dashboard reframes the program in P&L terms and shows whether business value is being realized gate by gate.